Financial Modelling – A Black Art?
Tuesday, 31st July 2018Guest blog by JL Advisory LLP
Although some of us that produce financial models would like you to think so to maintain the illusion, financial modelling is not a black art. Indeed, if you can follow a best practice structure and principles you can pretty much model any business, investment or venture that you want.
We have produced financial models for many different clients ranging from large multi-national companies to small coffee shop businesses. If you know the key income, cost and working capital drivers behind the business or project in question, you can build a financial model for anything in any sector.
There are plenty of financial modelling principles and guidelines out there, but I find the most useful is “The FAST Standard”. I won’t bore you by simply reciting the content of this standard – you can read through it at your leisure (http://www.fast-standard.org/the-fast-standard/) – but the acronym is a useful tool to remember when starting to build a model from scratch:
Flexible, Appropriate, Structured, Transparent
I would prefer to take these in a slightly different order and start with the Structure of a model, which is the most important element. Every model we build follows the same standard structure as follows:
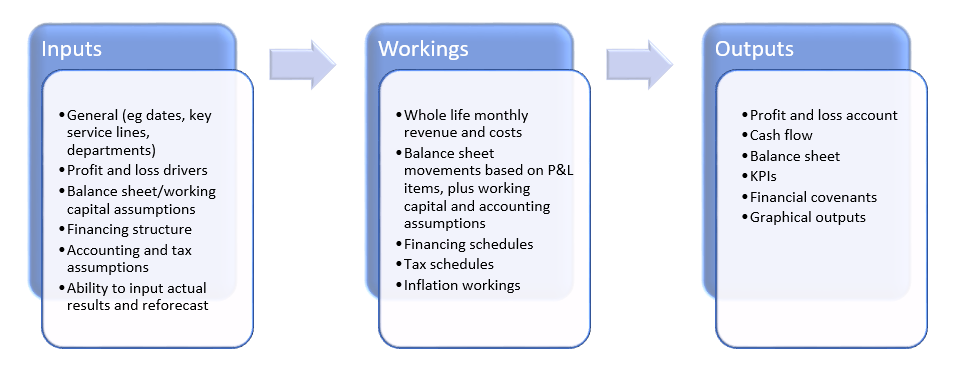
To develop the worksheets above, I tend to use the following rules:
- The Inputs worksheet(s) should contain mainly hard coded inputs and no calculations;
- The Working sheet should contain calculations only and no hard-coded inputs; and
- The Output sheet should summarise information from the Workings sheet in a format that relates easily to existing client reporting.
- All inputs cells should be a coloured, so they are easily identified.
- At the top of each worksheet have a standard set of lines detailing the dates (whether monthly, quarterly, annual etc), the number of days in the period (to assist in any calculations) and a standard set of flags (see below).
A good model is one that can be easily understood by someone other than the author, bearing in mind that the user of the model may not be excel proficient. Simplicity and Transparency are therefore critical. It is too often perceived that the more complicated the model and formula within, the better. This is not best practice modelling. In order to achieve integrity in a model, there should be a clear and logical flow of assumptions and information through the model. Formulas should be kept to a manageable and understandable length. I try and stick to a rule that if a formula stretches over more than two lines in the formula bar it is too long and needs to be broken up onto different lines / calculations. Using flags at the top of each worksheet are a great way to assist in splitting / simplifying formula, which I will touch on below.
In keeping the model simple and transparent, you are enhancing the Flexibility. A model needs to have the functionality to flex the current set of assumptions and inputs as well as be easily developed for changes in the future. This could consist of a built-in scenario sheet, sensitivity capability or the ability to update the inputs for actual data. This is not suggesting that the model should be built to accommodate every eventuality, but more that it is future proofed as far as possible for the business in question without threatening the simplicity and transparency noted above.
The model needs to be Appropriate and not unnecessarily detailed. Most models are built to provide a forecast, which in its very nature is not a reflection of absolute reality and precision. The model should reflect the key business assumptions and drivers but not be over engineered. If you are unsure about a set of assumptions, it is better to use more general assumption and stress test these through sensitivity analysis than provide overly detailed assumptions with overly complicated workings. Having said that, there is a balance to be had. For the model to be useful, all key/material cashflows should have an appropriate level of assumptions underlying them, such that the user can understand its main components and drivers.
Finally, my last piece of advice would be the use of flags. Flags are a great tool to represent changes in time periods and to use in formula to shorten the length and maintain simplicity. A flag is usually annotated by a number, the most common being a simple binary ‘1’ or ‘0’. For example, if a new office or department is due to open on a certain date, the flag line would be ‘0’ prior to the period of opening, and ‘1’ thereafter. All income and costs relating to that office or department can then link to the flag.
It is useful to have a standard set of flags at the top of the Workings and Output sheets which may represent some of the following:
- Monthly / quarterly / semi-annual / annual period number
- Investment period / transaction date
- Inflationary uplift
- Tax payment periods
- Interest / debt repayment periods
As you go through building and developing the model, if there is an element of the formula that is driven by a certain point in time or switch between two periods, then put a flag at the top of the worksheet and link the formula to the flag instead of trying to calculate it all in a single line.
Financial modelling offers endless opportunity for fun. However, if you have a need but still don’t want to delve into the world of Excel, then please feel free to contact us at JL Advisory. We not only build financial models from scratch but adapt already established financial models that may no longer be fit for purpose. We also provide financial modelling training courses for those that want to build their own models and want to understand the best practice methodologies and some of the tricks of the trade.